



Quick note before we start.
This is one of twelve free posts you will see this year. Paid subscribers get around a hundred.
That difference is: every major consumer deal broken down from the filings rather than the headlines. Reverse-engineered financials on brands your competitors are watching. Frameworks you can take straight into a pitch, a board paper or a negotiation. And the analysis published while it is still useful, not three weeks after everyone else.
If you have been on the free list for a while and this post is the kind of thing you want more often, now is the moment. Subscribe here.
33p a day. Less than you spend on coffee in a week.
Charlotte Tilbury filed its accounts at Companies House this month and the coverage was uniformly positive.
Turnover up almost 11% to £539m. Profit before tax up just under 15% to £21m. A successful launch in Mexico. A debut on Amazon’s US Premium Beauty store. Headcount up around 19% to 1,012 people.
Every outlet ran a version of “Charlotte Tilbury profits rise as sales climb.” Nobody ran the division.
£21m divided by £539m is a 3.9% pre-tax margin.
For one of the most culturally powerful beauty brands in the world. A brand with Magic Cream and Pillow Talk. A brand with genuine pricing power, a founder who is a household name, and a cult following that most companies would pay anything to manufacture.
Less than 4p of pre-tax profit from every pound of revenue. For comparison, L’Oréal runs a 20.2% operating margin.
And there is a company in the UK right now, in the same broad category, roughly a seventh of Charlotte Tilbury’s size, converting revenue into profit at five times the rate.
I want to walk through what the numbers actually say, what I think is driving it, and where I am inferring rather than knowing.
What We Actually Know From The Filing
Companies House accounts for a private company give you turnover, profit before tax, employee numbers and dividends. They do not give you the full cost breakdown you would get from a listed company’s income statement.
So here is what is confirmed

Growth drivers cited: consistent performance across existing markets, launch in Mexico, debut on Amazon’s US Premium Beauty store.
Everything beyond that is inference, and I will flag it as such.
The Comparison: A Company Selling LED Face Masks
The Beauty Tech Group listed on the London market this year and published its first half results as a public company for the six months to 30 June 2026.
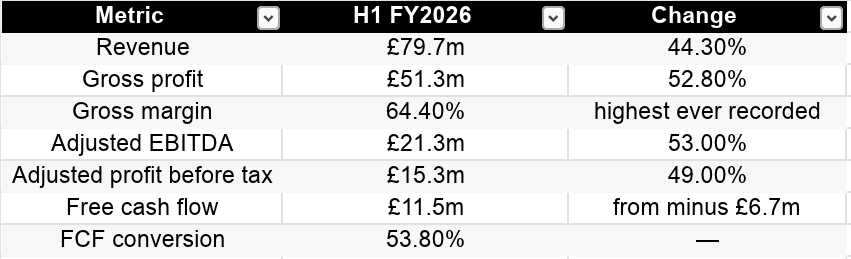
They own CurrentBody, the LED mask business, and ZIIP Beauty, which grew 25.7% to £7m in the half. Now the comparison, done properly.
Charlotte Tilbury: £21m PBT on £539m revenue = 3.9%.
Beauty Tech Group: £15.3m adjusted PBT on £79.7m revenue = 19.2%.
That is 4.9 times the margin. One honest caveat on that, because I have seen the comparison run badly elsewhere this week.
If you compare Beauty Tech Group’s adjusted EBITDA margin of 26.7% against Charlotte Tilbury’s pre-tax margin of 3.9%, you get almost seven times. That comparison is wrong. EBITDA sits above depreciation, amortisation, interest and tax. Pre-tax sits below all of them. They are different lines and comparing them inflates the gap.
The honest number is 4.9x, on the closest like for like basis available. That is still extraordinary. And there is a second caveat worth stating. Beauty Tech Group’s figure is “adjusted,” and it is a half-year that excludes IPO costs. Charlotte Tilbury’s £21m is statutory. Adjusted figures flatter. The real gap is probably somewhere between 3x and 5x rather than exactly 4.9x.
It is still the most interesting unanswered question in UK beauty.
Where The Money Goes: Four Hypotheses
I cannot tell you definitively from the public filing. I can tell you what the available numbers point toward and rank them by how well supported they are.
Hypothesis 1: negative operating leverage. This one is in the data.
Revenue grew around 11%. Headcount grew around 19%.
Work it through:
This year: £539m across 1,012 people = £532,600 of revenue per employee.
Last year, backing out the growth rates: roughly £486m across roughly 850 people = £571,300 of revenue per employee.
Revenue per employee fell by approximately 6.8%.
When headcount grows faster than revenue, you are not getting operating leverage. You are getting the opposite. Every new person has to generate more than their fully loaded cost to be accretive, and in a year where revenue growth was 11% and headcount growth was 19%, the arithmetic is working against you.
Now, there is a perfectly good reason this might be deliberate. You cannot launch in Mexico and onto Amazon US Premium Beauty without hiring ahead of the revenue. Investment years look exactly like this.
The question is whether it reverses next year. If revenue per employee climbs back above £570k in the FY27 accounts, this was investment. If it falls again, it is structural.
Hypothesis 2: the channel mix.
This is inference, but it is well-grounded inference. Charlotte Tilbury sells heavily through wholesale. Sephora, Boots, Harrods, Selfridges, Space NK, department stores globally, and now Amazon US.
Wholesale revenue is reported at wholesale price, not retail price. So that £539m of turnover might represent something closer to £1 billion or more in retail sales value, with the retailer capturing the difference.
Which means Charlotte Tilbury is running a lower effective gross margin than its retail prices suggest, while still carrying the full brand-building cost of a prestige house: campaigns, ambassadors, counter fixtures, beauty advisors, sampling, gifting, events.
You are paying prestige marketing costs on wholesale margins. That is a genuinely difficult structure.
Beauty Tech Group, by contrast, appears to run a far more direct model. A 64.4% gross margin on devices implies they are capturing most of the retail value themselves.
Hypothesis 3: SKU complexity.
Charlotte Tilbury carries hundreds of SKUs. Foundations across dozens of shades. Lipsticks across dozens of shades. Concealers, powders, blushes, each multiplied by shade range. Beauty Tech Group sells a handful of devices.
Shade matrixed cosmetics carry costs that device businesses simply do not have:
Inventory across every shade in every market, whether or not it sells. Obsolescence when a shade underperforms. Warehousing complexity. Returns driven by shade mismatch, which in beauty accounts for roughly 55% of all returns. Markdown on slow-moving shades.
None of that touches the gross margin line in an obvious way. All of it grinds away below it.
Hypothesis 4: intercompany arrangements. Flagged, not claimed.
Charlotte Tilbury is owned by Puig, which acquired it in 2020 at a reported valuation of around $1.2 to $1.3 billion.
It is entirely normal for a group to charge subsidiaries for brand licensing, management services, shared infrastructure or group financing. Those charges sit in the subsidiary’s costs and reduce its reported profit while the economics accrue at group level.
I want to be careful here. I have no evidence of what, if any, such arrangements exist, and this is standard practice rather than anything untoward.
The point for readers is methodological rather than specific, when you look at a UK subsidiary of a foreign parent, the reported profit of that entity is not necessarily the economic profit of the business. Always ask where the parent sits in the structure before concluding a brand is unprofitable.
No dividends were paid during the year, which tells you cash stayed in the business. That is consistent with an investment year.
The Structural Argument: Why Devices Beat Cosmetics On Economics
Beyond company specific factors, there is a category argument here that founders should understand, because it applies well beyond these two businesses. Four structural advantages a device business has over a colour cosmetics business:
No shade matrix. One SKU serves every customer. No inventory spread across forty foundation shades, no obsolescence on the slow ones, no markdown cycle.
Dramatically lower return rates. Shade mismatch drives the majority of beauty returns. A device either works or it does not, and the customer knows which within a fortnight.
Demonstrable results reduce marketing dependency. An LED mask can be shown working in a before-and-after. A lipstick competes on aesthetics and aspiration, which requires continuous, expensive brand investment to sustain.
Higher price point, lower frequency, better unit economics. A £300 device with a £100 cost of goods generates more absolute gross profit per transaction than fifteen £30 lipsticks, with a fraction of the fulfilment and returns handling.
The counter-argument, which is real: devices have a longer replacement cycle. Someone buying a mask may not buy again for years. Cosmetics generate genuine repeat purchase. Lifetime value could favour cosmetics even where per-transaction economics favour devices.
Beauty Tech Group’s answer to that appears to be portfolio. CurrentBody for masks, ZIIP for microcurrent, and a stated strategy of adding adjacent technologies. Build the device equivalent of a routine and you solve the frequency problem.
What This Means For Puig, And For The Estée Lauder Conversation
I wrote earlier this year about reported merger talks between Estée Lauder and Puig to create a prestige beauty group with around $20 billion of sales. The market’s reaction was unambiguous. Estée Lauder fell roughly 8%. Puig rose roughly 11%. Investors concluded Estée Lauder was overpaying.
These accounts give that view some support, and it is a line of analysis nobody has run.
Puig’s full-year revenue is around €5.29 billion. Charlotte Tilbury, at £539 million, is one of its most significant and most culturally valuable assets. It is the brand Puig points to when explaining its prestige credentials. And six years after acquisition, on a statutory basis, it is running at 3.9%.
Two readings, and they lead to opposite conclusions.
The bull case: Charlotte Tilbury is deliberately suppressing near-term profit to fund international expansion, Mexico and Amazon US being this year’s examples, and the margin normalises sharply once the investment cycle completes. If the brand converts at even 12% once mature, that is £65 million of PBT at current revenue, and considerably more at scale.
The bear case: this is what the margin looks like. Prestige colour cosmetics sold predominantly through wholesale, with the marketing intensity the category demands, structurally converts in the low-to-mid single digits. In which case the synergy case for a merger looks considerably weaker, because you are combining two businesses with the same underlying problem.
I do not know which is right. But the filing has given us a number to test it against, and the FY27 accounts will settle it.
Watch revenue per employee. If it recovers above £570,000, it was investment. If it does not, it is structure.
What Founders Should Actually Take From This
Five things, and they generalise well beyond beauty.
Revenue growth and margin are independent variables. Treat them that way.
Charlotte Tilbury grew 11% and converts at 3.9%. Beauty Tech Group grew 44% and converts at 19.2%. Growth tells you about demand. Margin tells you about structure. A business can have world-class demand and a broken cost structure at the same time, and the first one will hide the second one for years.
Track revenue per employee every quarter.
It is the cheapest early-warning system available and almost nobody uses it. Take revenue, divide by headcount, track the trend. If it is falling, you are adding cost faster than you are adding output, and you will feel it in the P&L twelve to eighteen months later. Charlotte Tilbury’s fell roughly 6.8% in a year where revenue grew 11%. That is the kind of thing a board should be asking about.
Channel mix is a margin decision disguised as a distribution decision.
Every wholesale door you open captures reach and gives away margin. That is often the right trade, particularly for scale and credibility. But if your cost base is built for prestige and your revenue is recognised at wholesale, the gap has to come from somewhere, and the somewhere is your operating margin. Model the blended margin of your channel mix before you sign the retail deal, not after.
SKU proliferation is the most underestimated cost in consumer.
Every additional shade, size or variant adds inventory, forecasting error, warehousing, obsolescence risk and markdown exposure. None of it is visible in gross margin. All of it is visible in operating margin, eighteen months later. If you are running more than fifty SKUs and you cannot tell me the contribution margin of your bottom twenty, that is your next board paper.
Read the subsidiary accounts, but read them carefully.
Companies House is free, and the filings of UK subsidiaries of global brands are one of the most underused research resources available to anyone in this industry. But understand their limits. A subsidiary’s reported profit reflects intercompany arrangements, transfer pricing and group structure. It tells you what that legal entity made. It does not always tell you what the business earned. Use it to form questions, not conclusions.
Where I Land
Charlotte Tilbury is an extraordinary brand. Nothing in these accounts changes that. £539 million of turnover, growing 11%, with genuine global cultural standing and two successful market launches in a single year. Most businesses would take that trade without hesitation.
But 3.9% is 3.9%, and the question of whether that is an investment year or a structural ceiling is the most interesting open question in UK beauty right now. Meanwhile a device business a seventh of its size, selling LED masks, is converting revenue into pre-tax profit roughly five times more efficiently, with a 64.4% gross margin and better than half of EBITDA dropping through to free cash flow.
Brand strength and business quality are different things. We spend almost all of our time in this industry discussing the first and almost none discussing the second, largely because the first is easy to see and the second requires opening a filing.
The filings are free. The analysis takes an afternoon. And it tells you considerably more than the press release.
The FY27 accounts will settle the investment-versus-structure question. I will run the same analysis when they land. If you want to check my working on any of this, every figure above is from public filings and I am very happy to be corrected.
Analysis and opinion, not investment advice. Figures are from Companies House filings and published results. Where I have inferred rather than observed, I have said so. I hold no position in any company mentioned.
P.S. A gross margin tells you whether your product makes money. An operating margin tells you whether your company does. Charlotte Tilbury almost certainly runs a higher gross margin than Beauty Tech Group, because prestige cosmetics typically sit in the 70 to 80% range against Beauty Tech Group’s 64.4%. And it still converts at a fraction of the rate. Which means the entire difference sits below the gross line, in operating costs, and that is the part of the P&L almost nobody interrogates. When a business with a better product margin makes less money, the problem was never the product.
P.P.S. If you want to run this analysis on your own competitive set, it takes about 20 minutes per company and costs nothing. Go to Companies House, search the UK entity, open the most recent full accounts, and pull four numbers: turnover, profit before tax, average employee headcount and dividends. Then calculate PBT margin and revenue per employee, and compare both against the prior year. Those four inputs and two ratios will tell you more about a competitor’s actual health than a year of reading their press coverage. Most of your competitors have never done this to you. Almost none of them expect you to have done it to them.